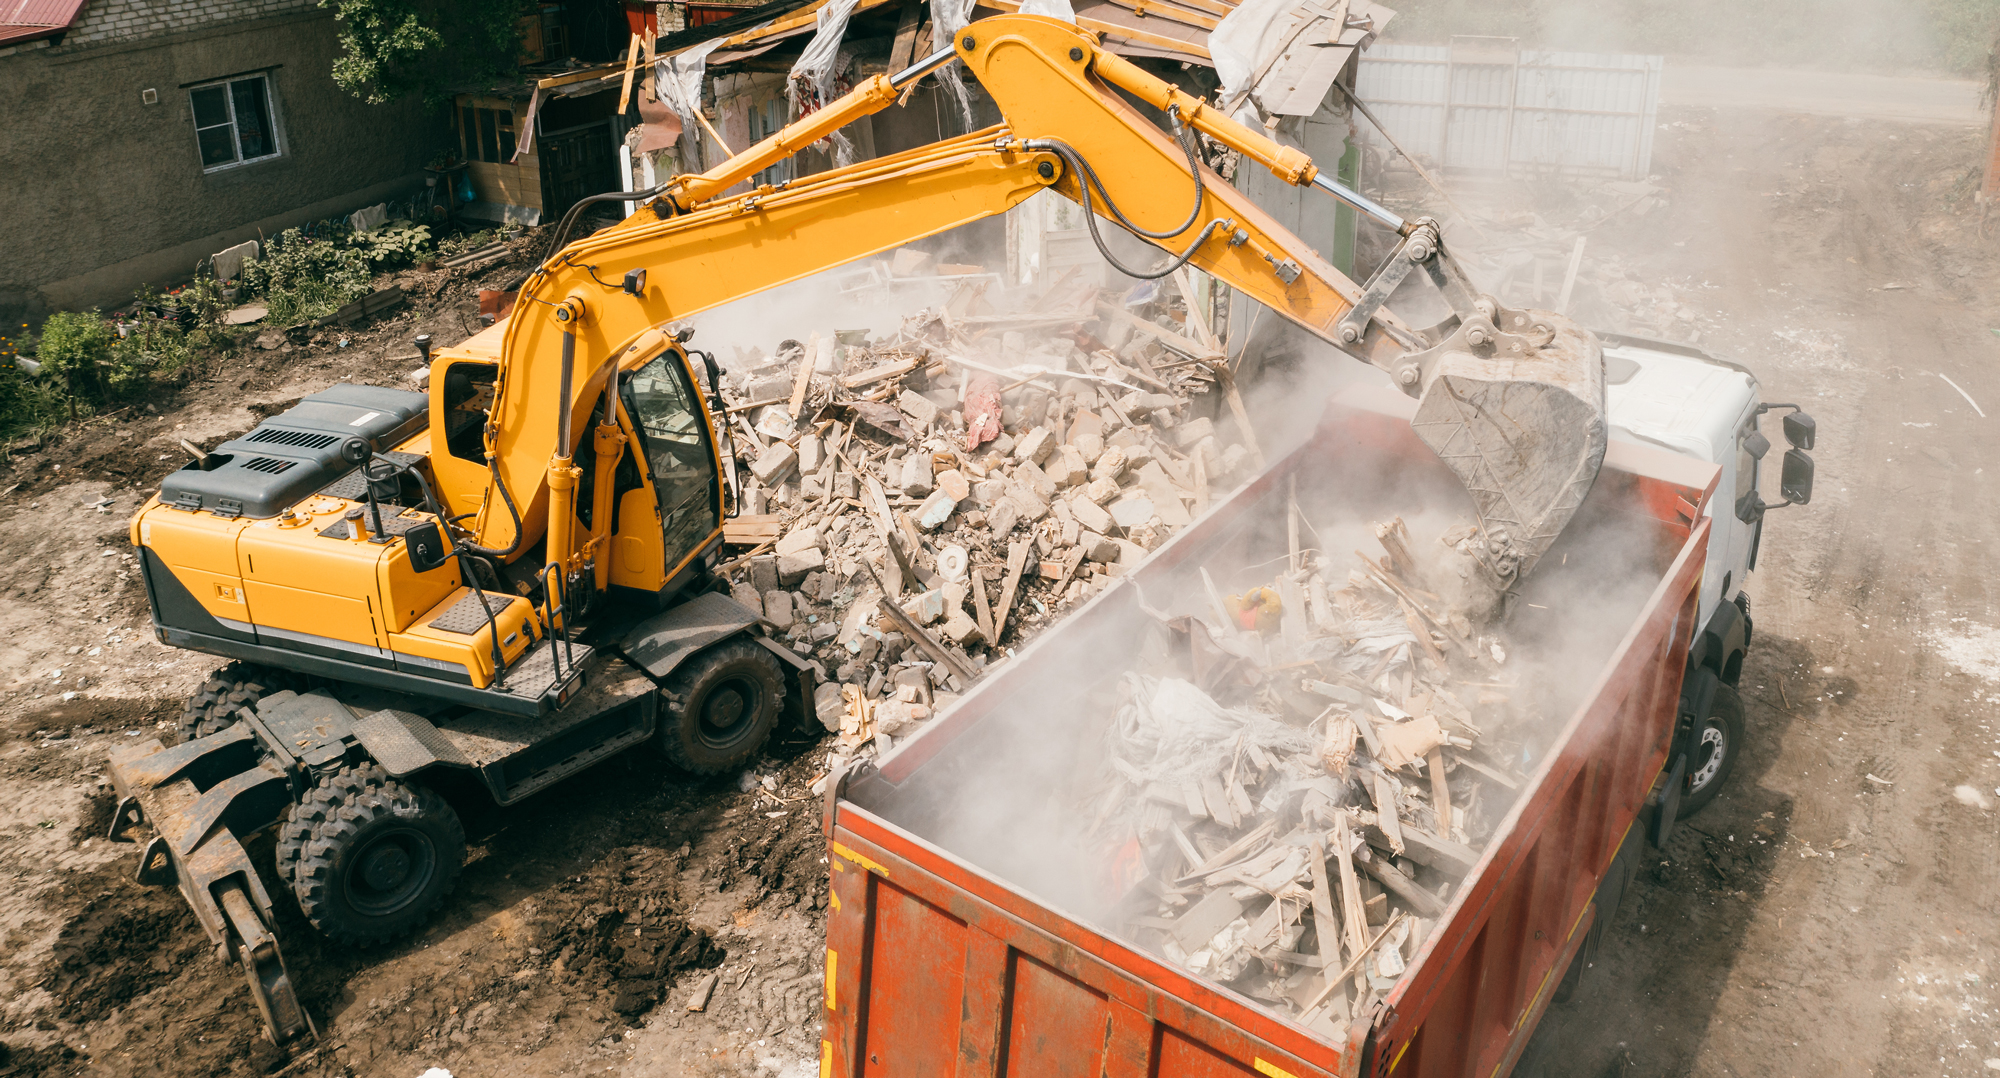
Construction Waste, often referred to as Construction & Demolition (C&D) waste, is the by-product of waste materials generated during construction, renovation, or demolition. It includes a variety of materials that are no longer needed and need to be disposed of.
According to Defra’s UK statistics on Waste, the UK produced 222 million tonnes of waste in 2018.
The construction industry was the highest producing sector with over 137 million tonnes, making up 61% of overall UK Waste in 2018.
Here is a complete list of all waste generated by the construction industry in 2018.
| EWC Stat | Waste Type | Volume (Tonnes) |
| 12.1 | Mineral waste from construction & demolition | 65,135,530 |
| 12.6 | Soils | 58,105,809 |
| 12.7 | Dredging spoils | 11,318,836 |
| 06.1 | Metallic wastes, ferrous | 1,156,855 |
| 07.5 | Wood wastes | 641,501 |
| 06.3 | Metallic wastes, mixed | 603,846 |
| 06.2 | Metallic wastes, non-ferrous | 413,437 |
| 07.1 | Glass wastes | 104,198 |
| 07.4 | Plastic wastes | 98,284 |
| 10.1 | Household & similar wastes | 80,874 |
| 12.2, 12.3, 12.5 | Other mineral wastes | 37,220 |
| 12.8, 13 | Mineral waste from waste treatment & stabilised waste | 35,952 |
| 10.3 | Sorting residues | 23,391 |
| 07.2 | Paper & cardboard waste | 20,762 |
| 09.2 | Vegetal wastes | 8,538 |
| 08* | Discarded equipment | 4,249 |
| 10.2 | Mixed & undifferentiated materials | 3,686 |
| 01.1 | Spent solvents | 3,161 |
| 07.3 | Rubber wastes | 1,171 |
| 01.4, 02, 03.1 | Chemical wastes | 390 |
| 07.6 | Textile wastes | 163 |
| 03.2 | Industrial effluent sludges | 108 |
| 08.1 | Discard vehicles | 100 |
| 09.1 | Animal & mixed food waste | 95 |
| 11 | Common sludges | 72 |
| 07.7 | Waste containing PCB | 2 |
| 01.3 | Used Oil | 2 |
| TOTAL | 137,798,233 |
Source: